Advanced Bike Tech
Carbon fiber frames are lightweight, but how light is too light? It requires a lot of engineering to make sure your frame is light and strong.
It has been a little while, but last we left it we were discussing anisotropy and the design implications. Since then I have enjoyed one of the greatest perks of academia: summer! Summer enables me to leave the classroom behind and focus on some other things including some vacation which brought us back to Bozeman. Of course, working on this project is always like a vacation for me, so spending time with Carl, Bill, Loretta, Jeff, and getting to know Kyle was really great. Plus, there was some road tripping in @themuffinvan. great road tripping in @themuffinvan.

Let’s get back to business. In previous posts, we discussed some of the difficulties in dealing with composite structures, especially compared to metals, and identified the anisotropic, or variation in material properties based on fiber orientation, as a critical difference. It is this attribute that theoretically allows us to design a frame that can be stiff in one direction and compliant in another. Next, we dug into anisotropy by looking at a composite structure on a smaller scale to identify, and quantify, variations in material properties. It is these variations that must be considered in the design process it must be understood and the materials characterized.
Material characterization is where testing comes into play; each test gives insight into certain properties and performance often by tracking the load-displacement relationship. However, load and displacement are driven not just by material, but also by geometry. Consider two aluminum bars that are 1 cm and 2 cm thick, respectively. We can intuitively know that the thicker bar will hold more load before yielding or breaking. Likewise, if we have two test (aka gage) lengths with constant thickness of 10 cm and 20 cm, we will expect to see significantly more displacement from the longer, 20 cm gage length. Since we are interested in material properties, in both cases we normalize (fancy way of saying divide) by the geometry of interest to get stress and strain, respectively.
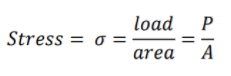
More specifically, stress is a measure of the intensity of an internal force distributed over a given section. Stress is defined as the force per unit area [1]:
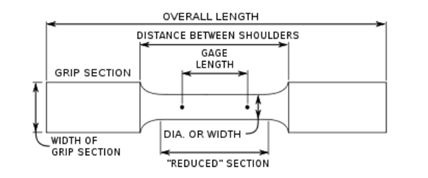
When a specimen is loaded so that the resultant force passes through the geometric center of the specimen cross-section, the loading is categorized as axial and can be either tensile or compressive. Results from simple tension tests can provide information from which several useful material properties can be determined. Figure 1 shows a flat tensile specimen before testing where the cross-sectional area is the width times the material thickness both in the gage length. It is worth noting that with composites it is common to have a consistent width for the entire specimen. This is a reflection of the individual lab and test being performed.
Figure 1. Typical tensile test specimen configuration with a reduced section.
Strain is a measure of the deformation that occurs in a material. For the case shown in Figure 1 where the specimen is subjected to an axial load, the axial strain may be defined as [1]:
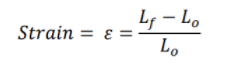
where Lo is the initial gage length and Lf is the final gage length. For cases where the cross section of the specimen changes over its length, the gage length Lo must be reduced to a sub-region of the specimen where the cross section is constant. In the case of Figure 1, the lengths considered would be a function of the method used to measure strain, which are discussed further below.
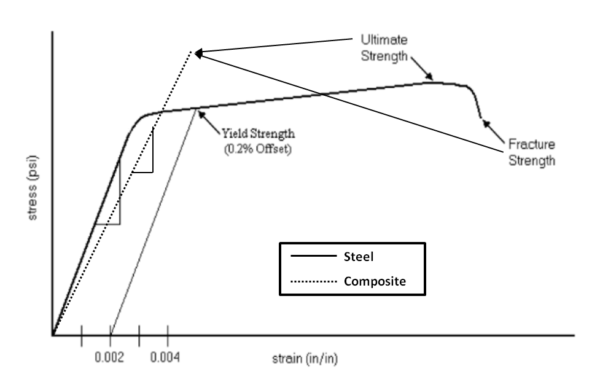
A useful way of presenting results from a tensile test is a stress-strain diagram. A typical stress-strain diagram from a tension test for a steel and a composite is shown in Figure 2. Load values, P, obtained during testing are converted to stress, σ, by dividing by the initial cross sectional area, A of the specimen. Strain is typically determined through the use of strain gages or extensometers. Depending on the ductility of the material the cross-section may decrease significantly at the failure location. This “necking” of the cross section indicates that the material is ductile (e.g. steel in Figure 2). Brittle materials display significantly less necking and thus the cross-sectional area does not decrease appreciably prior to failure (e.g. composite in Figure 2). Tests utilizing axial loading are generally performed to determine several specific material properties. Since it is important to understand which material properties are relevant and how those properties are obtained, we will save this for a separate discussion at a later date.
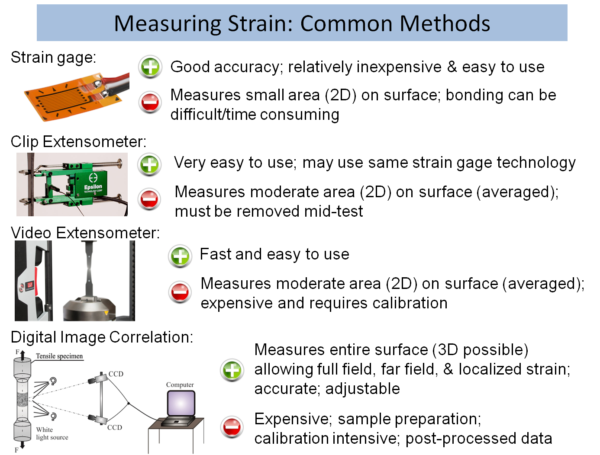
Figure 2. Representative stress-strain curve comparing steel and composite responses (ductile and brittle, respectively).
While measuring the load is straight-forward, measuring displacement or strain is not easy and there are several different accepted methods including strain gages, clip extensometers, video extensometers, and digital image correlation (DIC). In teaching mechanics of materials, I expose all of these methods to the students, but also show them that dial indicators and/or calipers can also be used for bench-top tests. Even though these bench-top tests may be crude, they can be very helpful, though the accepted strain methods above (and shown in Figure 3) are offer significantly better precision and accuracy.
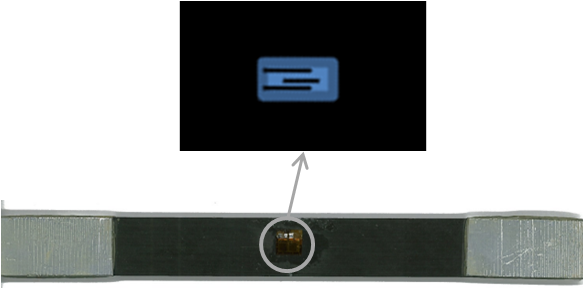
Figure 3. Comparison of commonly used and accepted methods to measure strain.
Strain gages consist of a very thin zigzagging wire with an applied current as shown in both Figure 3 and Figure 4. The entire strain gage surface is bonded to the surface of an object to be analyzed and is positioned at the point of interest with the wire parallel to the direction of desired normal strain reading (Figure 4). When the area that the strain gage is bonded to is subjected to deformation, the wire is stretched which increases the length and decreases the cross-sectional area of the wire. As a result, the resistance of the wire is increased and the current is measured. Careful consideration should be given to the fact that strain gages can only read normal strain and so placement is crucial such that the load and gage directions are aligned.
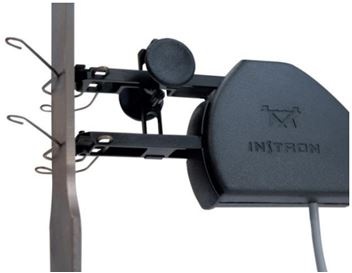
Figure 4. Composite tensile test specimen with strain gage applied with zoomed in cartoon of strain gage.
Strain gages are a type of local measurement technique. In experimental stress analysis, either local or full field measurement techniques can be used, depending on the application and on the data needed. In local measurement techniques, strain data about a single point can be collected without paying attention to what’s going on at other points on the same object. This is helpful when a single data point is indicative of the overall stress or strain state. On the other hand, full field techniques provide strain information about a large area and not a single point. This is useful when a more precise and detailed analysis about the object under study is needed, so that the strain state of many different points can be measured and compared at the same instant. Each of the other methods discussed, shown in Figure 3, consider larger areas.
An extensometer measures the strain by tracking the displacement between two spots on a specimen as shown in Figure 3. Some consider that it as a re-usable strain gage. The clip extensometer consists of a main body and two long arms extending almost parallel to each other from the body (Figure 5). At the end of each arm is a sharp edge and a wire-form hook for “grabbing” the specimen. The extensometer is positioned so that the center of the extensometer and the center of the specimen are in line. It is important to note that while easy to apply and remove, clip extensometers have a specific range of acceptable displacement and must be removed before reaching the maximum. Similarly, for high-energy failures where the specimen breaks suddenly and/or into many pieces. The video extensometer does the same thing, but uses a camera (similar to DIC) to measure the displacement of the two painted dots as the specimen is loaded. As such, it requires purchase of a more expensive system.
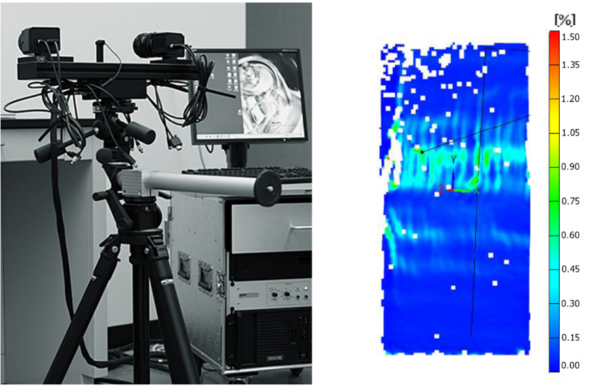
Figure 5. A typical clip extensometer used on a tensile specimen.
Given recent increases in camera and computing abilities, digital image correlation has become a widely used tool to measure displacements and strains with a typical system and result is shown in Figure 6. Digital image correlation (DIC) was first introduced into mechanics as a metrology tool to determine small strains by Peters and Ranson [2]. DIC is ideal for measuring an area, or volume if used stereographically, where sensitivity and non-contact are beneficial [3].
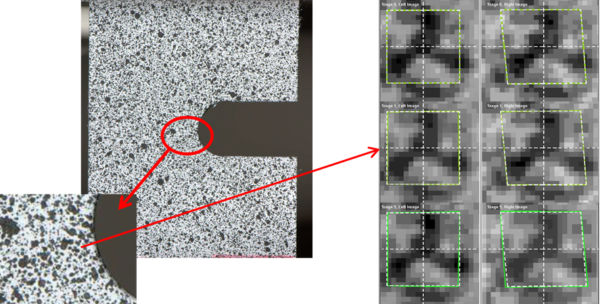
Figure 6. Digital image correlation (DIC) system utilized (left [3]) and a strain field indicating localized and full-field strains of a coupon in tension with wavy fibers (right [4]).
Simply stated, as a subject is deformed, cameras record images which are then analyzed by division into smaller sub-images from which displacements can be measured from a consistent starting point. It is required that the surface of the specimen is speckled (Figure 7) on a scale such that the pixels are able to be distinguished as either black or white. Images and sub-images are then compared through the deformation sequence using a correlation function [3-5]. This method deals with images as discrete, real functions where each pixel on the image has a numerical value and the images are dealt with simply as arrays of these values. Image correlation between two images is performed at user specified control points where deformations are then determined by variations in the array of these control points. Then within each image, the other sub-images are located relative to these points allowing for individual displacements and strains to be known. This is shown with the right image of Figure 7, where the two cameras are capturing the same area at each stage. Since deformation is occurring and the cameras are calibrated to the area, the deformation is quantifiable at each point (or image) through the test (Figure 7).
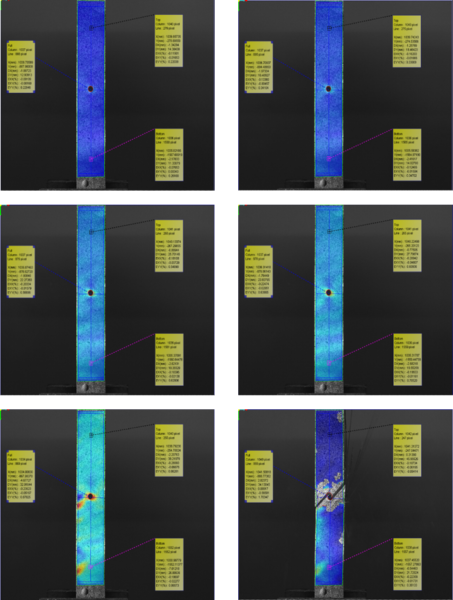
Figure 7. Speckled specimen shown with pixel group used to quantify local deformation.
Linking back to our discussion of anisotropy, it is important to determine material properties for composites in all directions to ensure proper design parameters meaning we can design and model things like bicycle frames more accurately and effectively. As such, DIC is being used more and more to determine elastic properties of composite laminates [5-10]. Within DIC, there are several methods that may be utilized based on the method of determining strain. The full-field, considered the entire area captured by the cameras, may be used where the strain of the entire field is measured locally and averaged for the entire surface. Conversely, localized areas may be measured near damage, or in far-field areas that are away from, and unaffected by, damage. It is the latter that is commonly utilized with strain gages, while extensometers offer measurements of an area somewhere between localized and full-field in size. Regardless, these values have been used to determine elastic properties such as Young’s modulus and Poisson’s ratio. While each of these methods have been used [8-10], comparison of the variations are not found within the literature.
In addition to material testing, the use of DIC is becoming more widespread as a convenient and effective method for damage monitoring of composite laminates and structures [6]. By utilizing full-field measurements (Figure 8), the entire surface of the coupon may be measured allowing for a better understanding of the different physical mechanisms during loading [7]. Laurina et al. noted that progressive damage may be seen and associated with failures within the laminate even though DIC measures only the outer, visible surface. By analyzing the displacement field on the surface, cracks that form within the laminate resulted in discontinuities and in some cases the cracks were associated to specific layers by identifying crack propagation direction [7-8]. This can be of particular use when considering a composite bicycle frame as damage may be visualized through a strain variation along a crack is visible. Likewise, it can be used to clearly identify problem areas under specific load conditions. This is an area that has been gaining traction recently and we at Pursuit see this as very valuable information especially when considering frames or sections of frames (Figure 9). We look forward to sharing more as we proceed. In the meantime, thanks for reading and as always questions are encouraged!
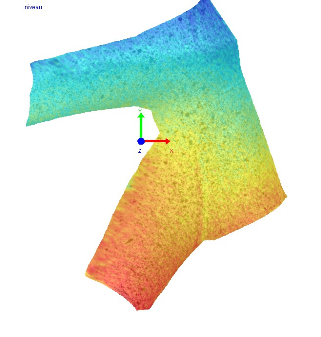
Figure 8. Strain progression through an open-hole tension test of a composite laminate.
Figure 9. DIC showing displacement of a head tube joint loaded under pedaling.